
Others
Sankey Charts can be used to represent all types of data interconnectedness. See a few examples below.
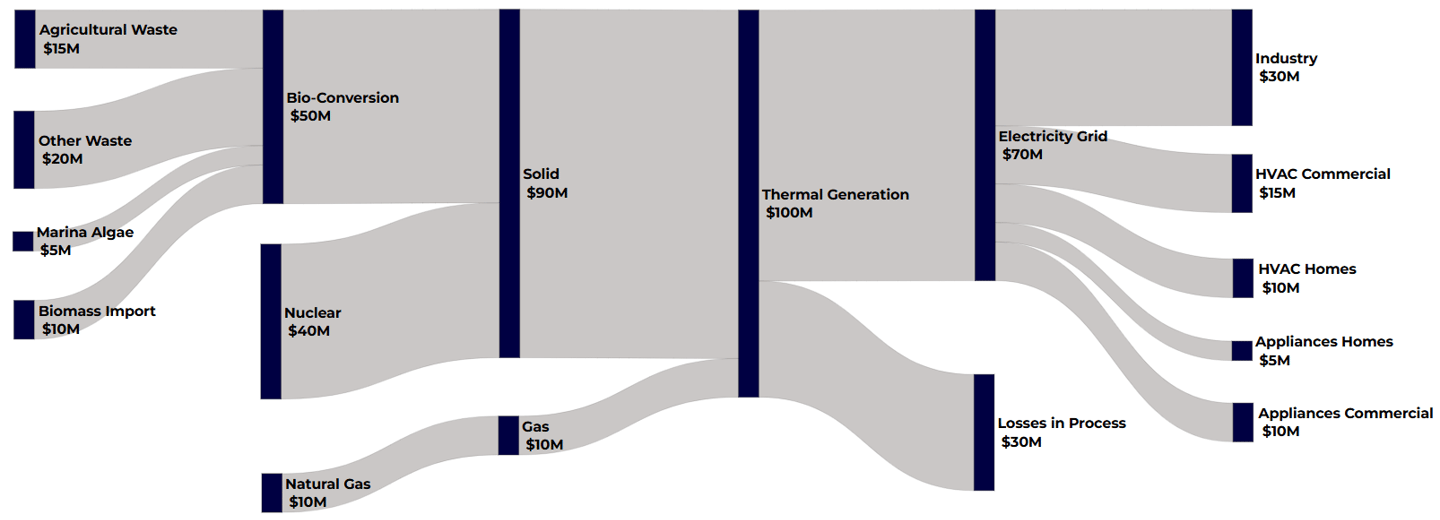
Science - Energy generation and usage
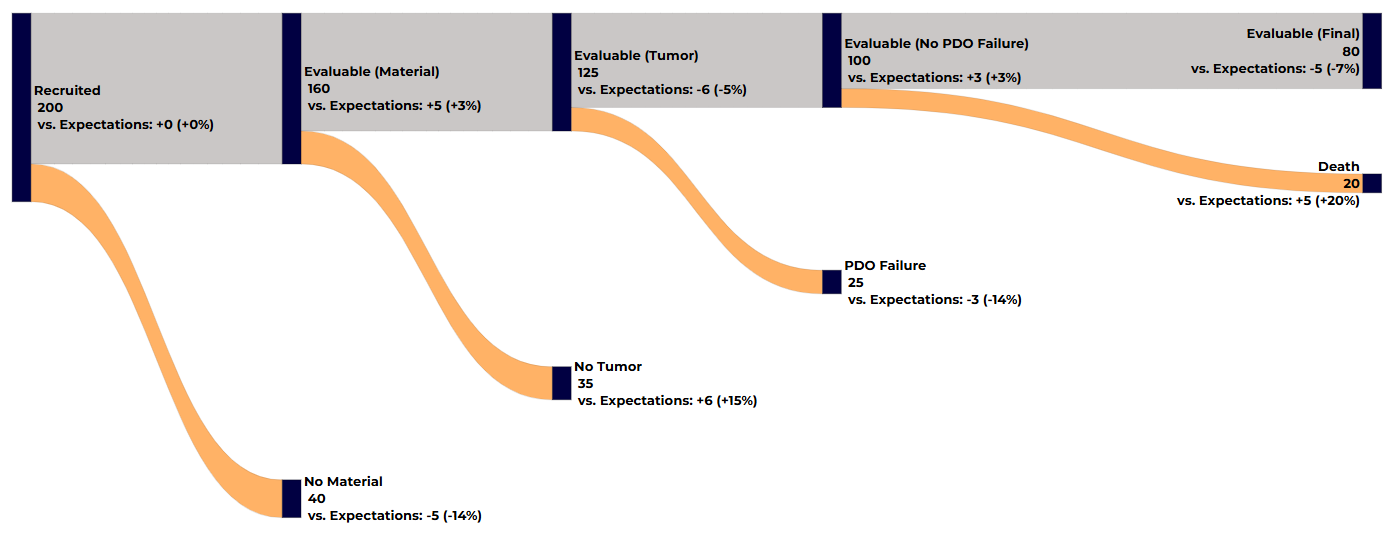
Science - Clinical Trial Enrollment
Sankey Charts can be used to represent all types of data interconnectedness. See a few examples below.
Science - Energy generation and usage
Science - Clinical Trial Enrollment